DAILY MORTGAGE RATE CHART
Most important point: the best use of this index is to track the CHANGE from day to day. There are so many things that can cause discrepancies between borrowers, lenders, and quotes. But because we use the same baseline scenario year after year, you can be sure that the CHANGE is a good representation of how rates are moving.
Although this chart shows the AVERAGE rates on today's market,
I can provide my clients with significantly lower rates than the average bank or lender with my wholesale pricing.
Please reach out with any questions! Ask me for a quote!
Kevin Dull - Edge Home Finance
Direct - (614) 665-8801
kevin@KDthebroker.com
Housing and Mortgage News Updates
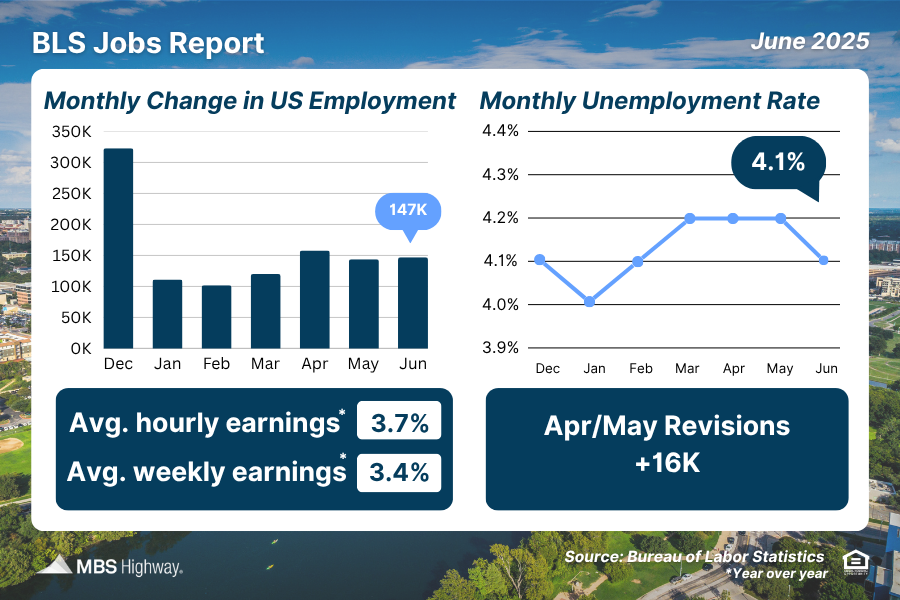
BLS Jobs Report
(Jun 2025)
June job growth came in above forecasts, with 147K new positions added vs. the projected 110K. Revisions for April and May raised the totals for those months by a combined 16K jobs. The unemployment rate fell from 4.2% to 4.1%.
#bls #jobs #unemploymentrate
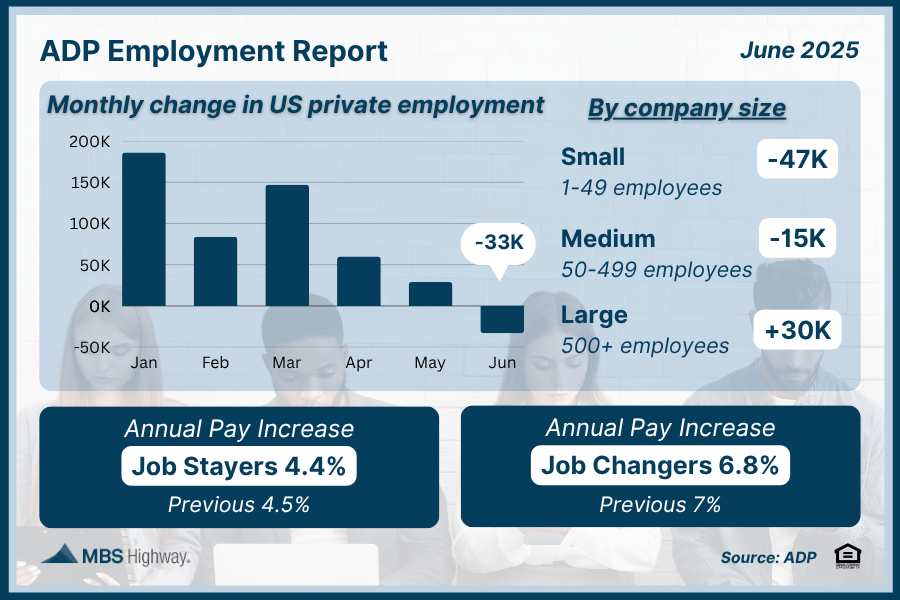
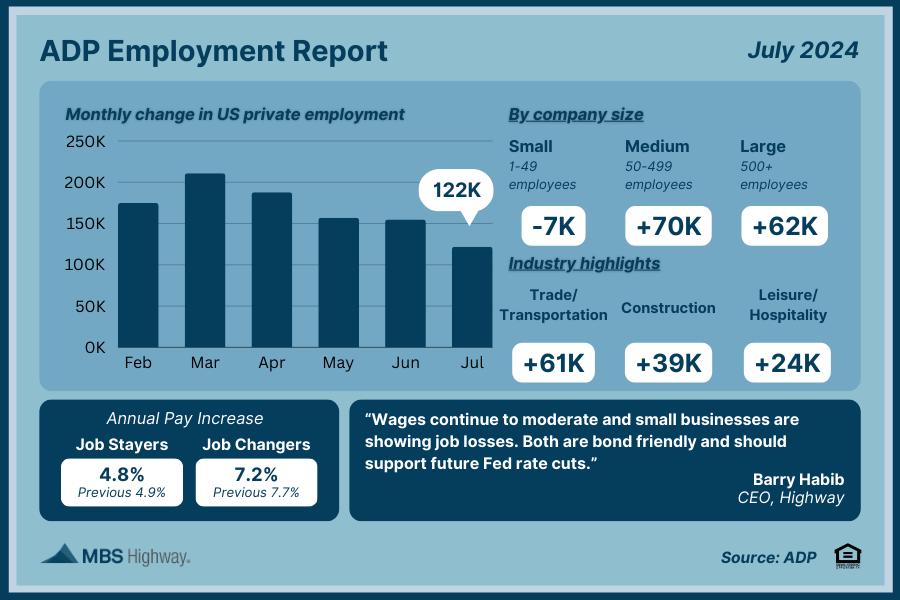
ADP Employment Report
(Jun 2025)
The private sector shed 33K jobs in June, per ADP. This was far below the expected gain of 95K and marks the first drop since March 2023.
#adp #employmentreport #mortgageintheknow
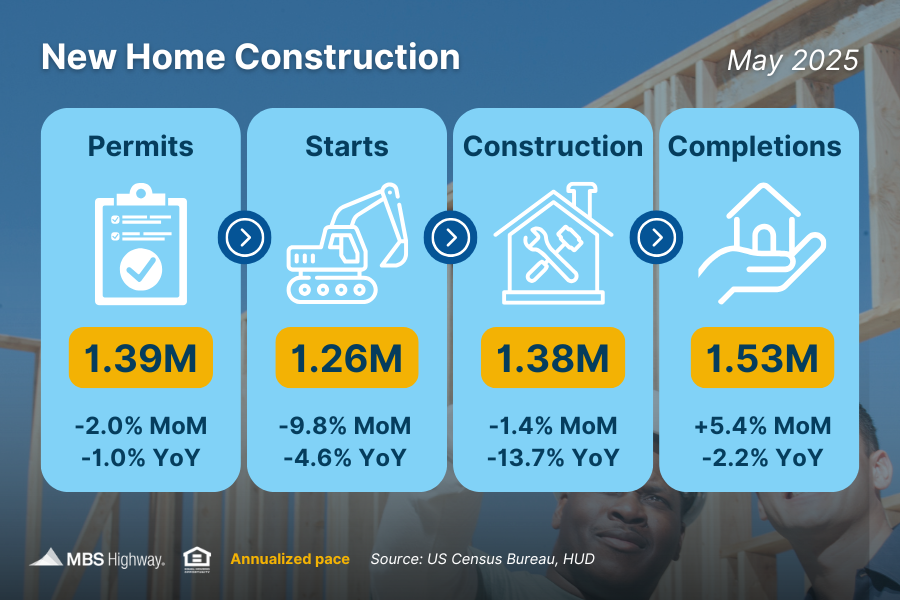
New Home Construction
(May 2025)
Housing Starts dropped by 9.8% from April to May, while Building Permits (a key indicator of future construction activity) decreased by 2%. Builders continue to exercise caution due to ongoing economic uncertainty.
#homebuyers #homebuilder #newconstruction
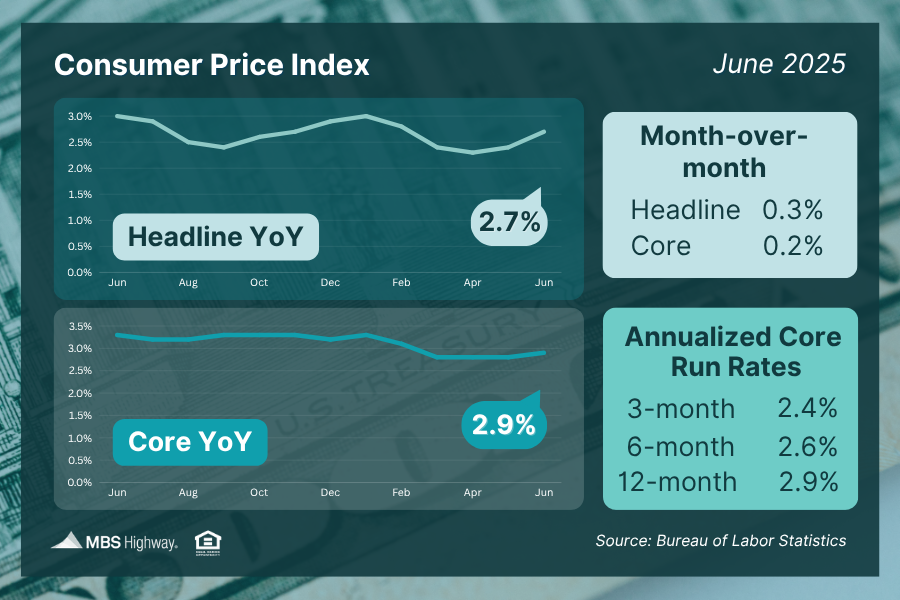
Consumer Price Index
(Jun 2025)
Inflation Update: In June, the Consumer Price Index (CPI) rose to 2.7% year-over-year, up from 2.4% in May. The Core CPI also increased, reaching 2.9% year-over-year compared to 2.8% in May.
#cpi #inflation
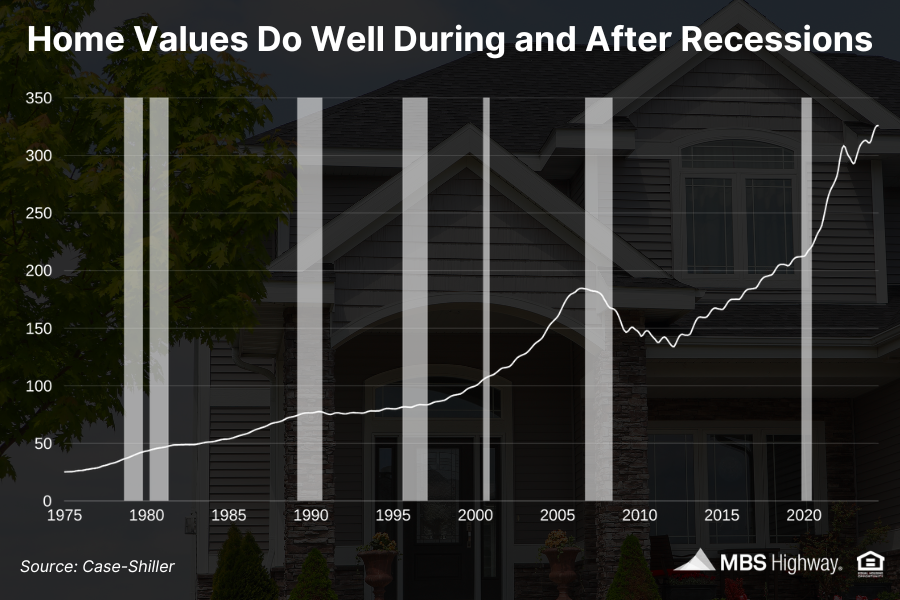
Home Value Performance During and After Recessions
There are fears that an impending recession may cause home values to drop. Although counterintuitive, this graph shows how well home values have performed through the vast majority of recessions.
#recession #homeprices
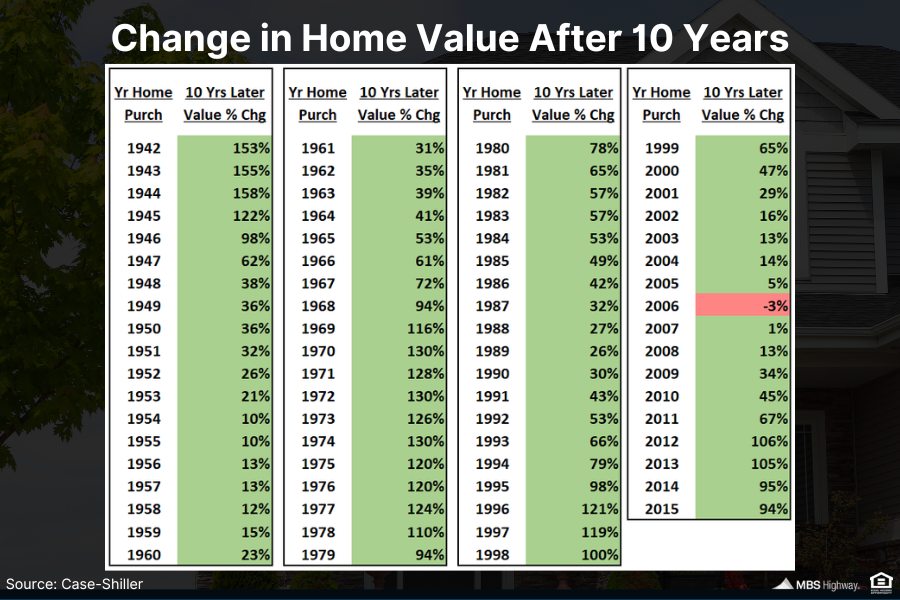
Change in Home Value After 10 Years
Talk about a winning record! Buying a home and holding it for 10 years has earned a profit every year except one since 1942. Just look at those returns, too! Housing builds significant, long-term wealth.
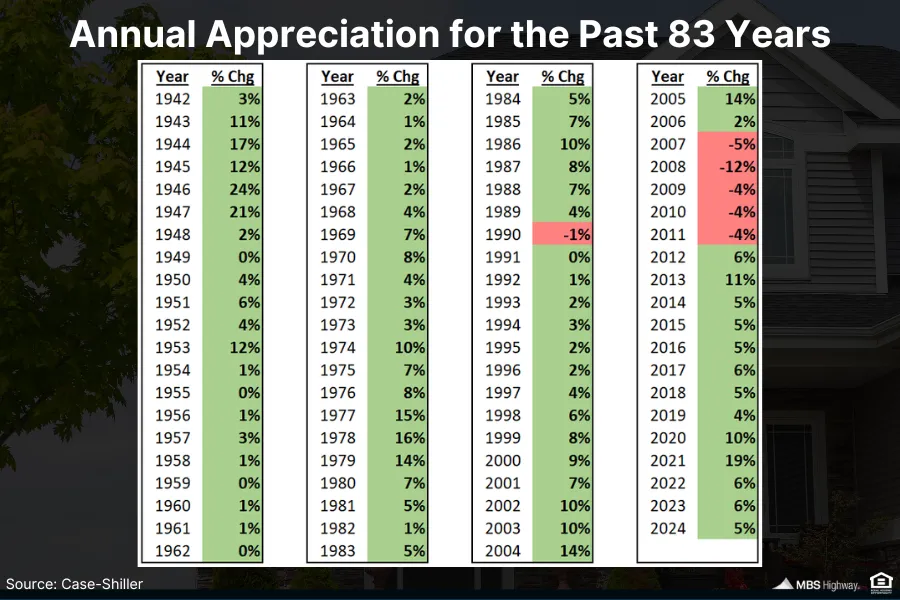
Annual Appreciation for the Past 83 Years
Going way back to 1942, Case-Shiller's national home price index has risen in 77 out of 83 years. That's a 93% hit rate for appreciation, with average annual home price growth of 5.4%.
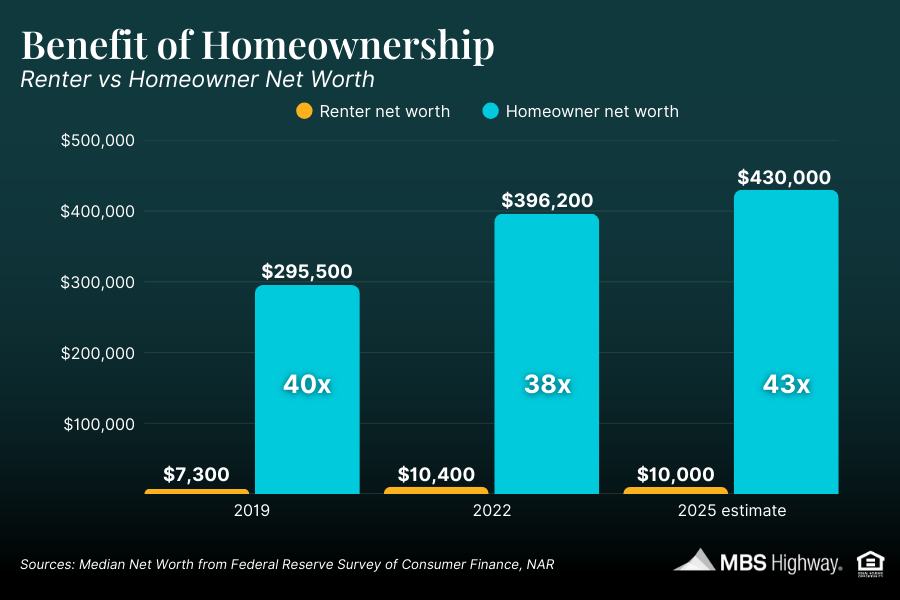
Renter vs Homeowner Net Worth
Talk about a winning choice! The average homeowner's net worth is 43 times that of a renter. Homeownership builds significant, long-term wealth and is a strategic move towards securing your financial future.
2025 Federal Income Tax Brackets
The IRS has raised the thresholds for income tax brackets and the standard amount Americans can deduct for tax year 2025. This could mean potential tax savings on these returns that are due in April 2026.
#taxes #irs
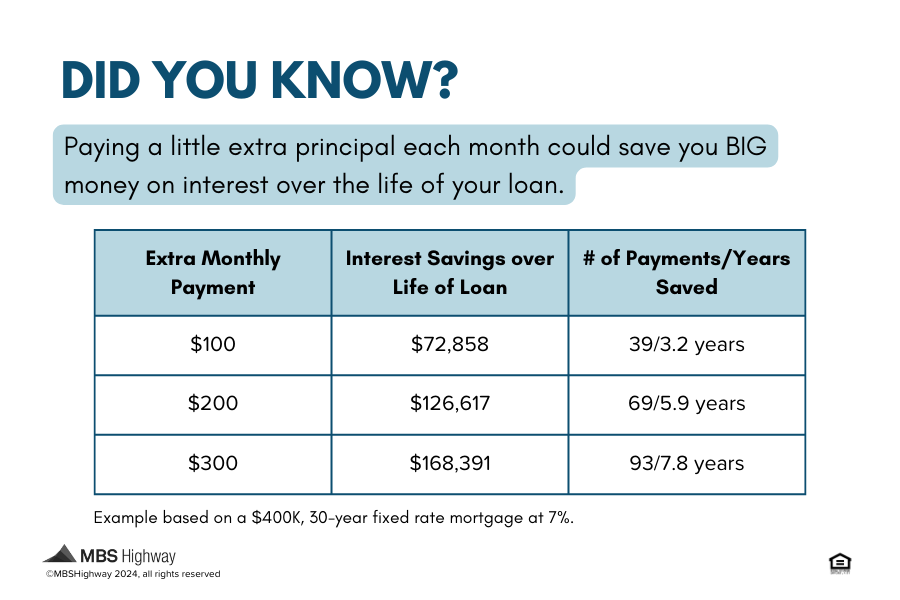
How to Save Money Over the Life of your Loan
Got a little extra income monthly? Making additional payments towards your principal helps you reduce the total amount of interest paid over time and also accelerates your path to full homeownership. Questions about how this strategy works? Send me a message and let's walk through your specific situation using my handy Amortization tool.
#homeowner #wealth #amortization #mbshighway #mbssocialshare #mortgagemarketnews #mortgageintheknow